Quantcast
Channel: SQL Memory Archives - SQL Authority with Pinal Dave
Viewing all 93 articles
Browse latest View live

SQL SERVER – Increasing Speed of CHECKPOINT and Best Practices

$
0
0

I must accept that I would not ask this question to anyone (particularly in the interview), however, I  received this question as a follow up of my earlier blog post which I wrote about SQL SERVER – Impact of CHECKPOINT and DBCC DROPCLEANBUFFERS on Memory.

If you are not sure what is CHECKPOINT and DBCC DROPCLEANBUFFERS, here are two blog posts which I have written on this subject before and I suggest you read them before continuing this blog post.

I also discuss this subject in detail at the Comprehensive Database Performance Health Check. Now, I assume that you have read above two blog posts so I will continue to answer the question which is the center of this blog post.

SQL SERVER - Increasing Speed of CHECKPOINT and Best Practices checkpoint-800x567

Brief Note about CHECKPOINT

SQL Server database engine often makes the changes in the database pages whenever there are various data modifications operations are performed. All the modifications are done in the memory buffer cache and those pages are called dirty pages. Every time if SQL Server Database engines go to write these dirty pages to the disk, it would be a big overhead to the engine. To avoid this burden SQL Server engine at certain interval writes the dirty pages to the transaction log and to the disk.

Challenge with Backups

CHECKPOINT itself is the reason why SQL Server Engine performs better and now the question is to even increase the speed of the CHECKPOINT. I asked a bit more in detail to the person who originally asked this question to me to understand what actually he means by increasing the speed of the checkpoint.

DBA explained to me that he knows that there is an automatic checkpoint operation but there are times when he has to take his database backup and it takes lots of time for him. He figured out that it is due to the checkpoint operation and whenever he ran the checkpoint first, he was able to take the database backup quickly. Everything was fine now but after a while, he realized that the manual checkpoints which he is running are taking lots of his time and he wants to run that even faster and hence the question.

Speed Up CHECKPOINT

Lots of people do not know that whenever you run Manual CHECKPOINT, you can also specify an additional parameter to instruct the operation to complete in the specific time period. The parameter which you pass to the operation is in seconds and once specified SQL Server will do its best to complete the operation in the time specified in the parameters.

As for my client, the entire operation was taking over 1 minute, I instructed him to specify the time duration to 10 seconds and it worked great for him. Here is the script to instruct the CHECKPOINT to complete in the specific time period.

CHECKPOINT durationinsecond
USE DATABASE;
CHECKPOINT 10 

He was pretty delighted with the time saved and he had plenty of available resources on the SQL Server. However, very next day he reached out to me again with a very different problem. Read about that in the next section.

Slow Down CHECKPOINT

After specifying the CHECKPOINT duration he was able to see a remarkable improvement in the databases where the entire operation was taking a very long time. This made him implement this option for other databases as well. There was one database for which the entire operation of CHECKPOINT was running in just 1 second now for that database the operation started to take longer; sometimes it took 5 seconds and sometimes even full 10 seconds. He was indeed surprised with the slowness of the operation as he expected that the new setting he is specifying will not affect any operation which was taking a lesser amount of the time but will only improve the performance of long-running processes.

He was absolutely wrong! 

The way the time duration parameter works, if any CHECKPOINT process is running faster than the parameter specified, SQL Server will now start giving fewer resources to those processes and it will now try to run slower to match up to the parameter specified. This means his processes which were running in 1 second now trying to run in 10 seconds.

He learned his lessons and stop using the parameter where it was not needed.

Best Practices

In the real world, there should not be any need to change CHECKPOINT operations. You should not modify the process unless there is a specific requirement for it. However, if you still want to change the speed of your operations, you can always specify a lower number for to speed up and a higher number to slow down your CHECKPOINT operation. Remember the time duration you specify is in seconds!

If you are still not sure what to with your CHECKPOINT, let us connect, you can always reach out to me by opting for any of the options mentioned on my HIRE ME page.

Reference: Pinal Dave (https://blog.sqlauthority.com)

First appeared on SQL SERVER – Increasing Speed of CHECKPOINT and Best Practices


SQL SERVER – SUSPENDED Sessions Waiting on PAGELATCH_UP and PAGELATCH_SH – Solution

$
0
0

Today, I have interesting experience while working with a client on Comprehensive Database Performance Health Check. I was working with Sr. DBA on optimizing their SQL Server. While working on it, we realized there was an issue with how their file configured for one of their major databases. As soon as we fixed that issue, suddenly their application started to run at rapid speed. However, the joy of fixing the server did not last long as within a few minutes their server got tremendously slow with many sessions suspending in the status of SUSPENDED status and they were waiting on PAGELATCH_UP and PAGELATCH_SH. I have fixed many such scenarios in the past but the way this scenario showed up this was very strange.

SQL SERVER - SUSPENDED Sessions Waiting on PAGELATCH_UP and PAGELATCH_SH - Solution suspended-800x270

Suspended Status

Suspended Status means that the request currently is inactive because it is waiting on a resource and there is a good chance the request will start once the needed resource will be available.

When I started to see the queries are suspended with the wait stat of PAGELATCH_UP and PAGELATCH_SH, it was immediately clear to me that this may be due to some internal SQL Server issue which was unrevealed as soon as I fixed the major blocking issue with the file.

Solution

After carefully looking at the situation, and evaluating various different performance tuning configuration issues, I realized that the issue was due to another misconfiguration of the TempDb. I noticed that there was a single tempdb file on the same drive as their data drive and was creating a performance issue. We immediately moved that file to a different drive and added few more (in our case 3 more) TempDB datafiles (ndf) and our performance issues were automatically resolved and all the queries got unsuspended. After a few minutes, the entire backlog was cleared the client got unparallel performance.

If you have start SQL Server Performance problem, I would love to connect with you and help you resolve it. I love solving challenging issues. Let us work together Comprehensive Database Performance Health Check

Related Blog Posts

How to check SQL Server Wait Statistics – Blog

How to check memory pressure? – Blog

How to move TempDB – Blog

Reference: Pinal Dave (https://blog.sqlauthority.com)

First appeared on SQL SERVER – SUSPENDED Sessions Waiting on PAGELATCH_UP and PAGELATCH_SH – Solution

Impact of CHECKPOINT On Memory – SQL in Sixty Seconds #084

$
0
0

Impact of CHECKPOINT On Memory - SQL in Sixty Seconds #084 checkpoint-800x450 Some concepts are so good in SQL Server, they keep on coming back to me one way or another way. After reading my recent blog posts about CHECKPOINTS lots of people wanted to see the demonstration of the same. In this SQL in Sixty Seconds video, I will show you the Impact of CHECKPOINT on Memory.

To understand what actually CHECKPOINT and DBCC DROPCLEANBUFFERS do first we need to understand a couple of more concepts which are what is a clean buffer and dirty buffer in memory. I suggest you read the following blog post before continuing reading this blog post.

Dirty Pages – How to List Dirty Pages From Memory in SQL Server? 
What is Clean Buffer in DBCC DROPCLEANBUFFERS?

Now, that you have read the blog post, I am confident that you know how Clean Pages and Dirty Pages work.

The next task is to get the script which displays dirty pages and clean pages in the buffer pool of the memory. Here is the blog post where I have written the blog post about that topic. How Dirty or Clean is SQL SERVER’s Memory?

Once you run the query on that page, you will get output similar to what you see in the video. Now is the time when you are ready to execute the keyword CHECKPOINT.

What this entire video over here:

If due to any reason, you are not able to watch the video, here is the blog post which will walk you through the entire story of the blog post with the images and scripts: SQL SERVER – Impact of CHECKPOINT and DBCC DROPCLEANBUFFERS on Memory.

Let me know what you think of this video. If you like similar videos, please leave a comment and I will build a few more SQL in the Sixty Seconds. Meanwhile, if you like to watch the longer video, I strongly suggest you watch my earlier video here where I discuss Indexes Reduces the Performance of SELECT statement.

Reference: Pinal Dave (https://blog.sqlauthority.com)

First appeared on Impact of CHECKPOINT On Memory – SQL in Sixty Seconds #084

Impact of DBCC DROPCLEANBUFFERS on Memory – SQL in Sixty Seconds #085

$
0
0

Impact of DBCC DROPCLEANBUFFERS on Memory - SQL in Sixty Seconds #085 85-FreeCleanBuffer-800x453 Some concepts are so good in SQL Server, they keep on coming back to me one way or another way. After reading my recent blog posts about DBCC DROPCLEANBUFFERS lots of people wanted to see the demonstration of the same. In this SQL in Sixty Seconds video, I will show you the Impact of DBCC DROPCLEANBUFFERS on Memory.

To understand what actually CHECKPOINT and DBCC DROPCLEANBUFFERS do first we need to understand a couple of more concepts which are what is a clean buffer and dirty buffer in memory. I suggest you read the following blog post before continuing reading this blog post.

Dirty Pages – How to List Dirty Pages From Memory in SQL Server? 
What is Clean Buffer in DBCC DROPCLEANBUFFERS?

Now, that you have read the blog post, I am confident that you know how Clean Pages and Dirty Pages work.

The next task is to get the script which displays dirty pages and clean pages in the buffer pool of the memory. Here is the blog post where I have written the blog post about that topic. How Dirty or Clean is SQL SERVER’s Memory?

Once you run the query on that page, you will get output similar to what you see in the video. Now is the time when you are ready to execute the keyword DBCC DROPCLEANBUFFERS.

What this entire video over here:

If due to any reason, you are not able to watch the video, here is the blog post which will walk you through the entire story of the blog post with the images and scripts: SQL SERVER – Impact of CHECKPOINT and DBCC DROPCLEANBUFFERS on Memory.

Let me know what you think of this video. If you like similar videos, please leave a comment and I will build a few more SQL in the Sixty Seconds. Meanwhile, if you like to watch the longer video, I strongly suggest you watch my earlier video here where I discuss Indexes Reduces the Performance of SELECT statement.

Reference: Pinal Dave (https://blog.sqlauthority.com)

First appeared on Impact of DBCC DROPCLEANBUFFERS on Memory – SQL in Sixty Seconds #085

SQL SERVER – Using Memory-optimized Tables and Native Stored Procedures – Video Course

$
0
0

I am happy to announce that I have just published my recent SQL Server Performance Tuning video course on Pluralsight on the topic – Using Memory optimized Tables and Native Stored Procedures.

The In-Memory OLTP feature adds a new memory-optimized RDBMS engine and a native compiled stored procedure. This new addition adds higher concurrency to the SQL Server and enables it to process a much higher amount of the workload than before. In this course, we will learn about how to get started with the memory-optimized tables and build a use case around its effectiveness. Additionally, we will also understand how the efficiency of the stored procedure is increased when we use Native Stored Procedure along with Memory Optimized Table.

SQL SERVER - Using Memory-optimized Tables and Native Stored Procedures - Video Course memory-optimized-800x450

Table of Content

  • Course Overview
  • Creating Memory-Optimized Tables
  • Optimizing Performance of In-Memory Tables
  • Creating Natively Compiled Stored Procedures
  • Collecting Execution Statistics for Natively Compiled Stored Procedure
  • Summary

You can visit the course page over here and further expand each topic to understand what is covered in each of the topics.

Convenience Your Boss for Memory Optimized

My day job is SQL Server Performance Tuning for various organizations and I always look for the opportunity to implement Memory-Optimized Tables and Native Compiled Stored Procedures at my client. However, the biggest push back, I receive from my client is on the following three topics:

  1. Durability of Data
  2. Resource Consumption
  3. Performance of Queries

I have addressed all the three topics in the course. Every module of the course has an interesting demonstration which describes each of the topics in the detail.

In the final module of Summary, I have included a short demonstration, which I use with my clients to convince them to start using In-Memory OLTP and Native Stored Procedures.

Watch The Course for FREE

The course is available on Pluralsight and if you have a subscription, you can watch my course. However, if you do not have a subscription for Pluralsight, you can immediately get a FREE subscription by signing up here.

Reference: Pinal Dave (https://blog.sqlauthority.com)

First appeared on SQL SERVER – Using Memory-optimized Tables and Native Stored Procedures – Video Course

SQL SERVER – Enable or Disable Resource Governor

$
0
0

Just another day, I was involved with a client during a Comprehensive Database Performance Health Check and ended up at a very interesting situation. Our client was struggling with the memory issue and the server was running super slow. Eventually, we fixed the problem by disabling the resource governor which was accidentally enabled by one of their database administrators. Let us learn how to disable resource governor in this blog post.

SQL SERVER - Enable or Disable Resource Governor resourcegovernor-800x172

The resource governor was accidentally enabled by DBA as the command of enabling the resource governor does not say there is a word Enable.

Enable Resource Governor

ALTER RESOURCE GOVERNOR RECONFIGURE;

DBA, when executed the above script, though he is just configuring Governor and not enabling it. After running the above script, he got busy with the other task and did not come back.  However, this is what actually created a very poor situation for their organizations as enabled Governor due to some reason lead to a memory issue.

When I was not able to find any other issue with their performance, I thought of checking resource governor and I figured out the issue may be related to it. To test the theory, we disabled it and immediately the performance was restored. Here is the script to disable Resource Governor.

Disable Resource Governor

ALTER RESOURCE GOVERNOR DISABLE; 

Once we disabled resource governor the problem went away for us.

Now here is one thing I want to stress upon. I believe Resource Governor is an amazing tool to manage resources in SQL Server. I have been using it with many of my clients over the years. Particularly, I believe it works great with In-Memory Technology and memory-optimized tables. However, if you incorrectly configure it, it can create a real stressful situation as well. I strongly recommend getting your resource governor configuration checked by Performance Tuning Expert before you enable it.

Reference: Pinal Dave (https://blog.sqlauthority.com)

First appeared on SQL SERVER – Enable or Disable Resource Governor

SQL SERVER – Query Specific Wait Statistics and Performance Tuning

$
0
0

SQL Server Performance Tuning is what I do for leaving and every single day, I get different problems to solve. Just another day I was hired for just 1 hour to solve one specific problem of my client with whom I had worked on Comprehensive Database Performance Health Check. This time I was able to help them with Query Specific Wait Statistics.

SQL SERVER - Query Specific Wait Statistics and Performance Tuning queryspecific-800x353

Sudden Slow Query

As I had previously worked with this client we had fixed pretty much every single avenue which can leak the performance for the client. We had worked extremely comprehensively to solve their performance problems. When they called me, I was expecting that their issue will be very complex.

However, the recent issue was very much common. They had one particular query which was earlier running very quickly suddenly started to run slow but all other queries were running at optimal speed.

Diagnosis – Lone Slow Query

During the investigation process, we figured out that all the other queries were running very fast but their one particular query was running very slow. This made things pretty simple for us. We spent some time to identify that one query and all the necessary parameters to run that query.

Once the query and parameters were available we tried many different tricks which are common in the performance tuning expert’s book to tune any slow running query. We were able to validate that there is no issue with parameter sniffing. Additionally, recompilation was also not helping our query.

We nearly spend 12 minutes in trying 8 different solutions to speed up the query but all attempts were in the vain.

Resolution of Query Specific Wait Statistics

Finally, I decided to run the query in the SSMS and check the query-specific wait statistics to know what is actually making the query very slow. As soon as I checked the SQL Wait Statistics for the query, I immediately realized why none of my previous attempts helped that one specific query.

The query which we were running needed a lot of memory and the server was running the query just fine as it had enough memory to run the query. In our case, the database which we were dealing with was 1.5 TB and server had over 512 GB of memory.

When I checked the wait statistics of the query, we realized that the query was really starving with the memory. Looking at the configuration of the server and past history of the query, we knew the memory was good enough for the query but still the wait statistics showed that as a problem.

Suddenly, I remembered that my other client had exactly the same problem a few weeks earlier and the resource governor was the culprit for the same. You can read about that here. I quickly checked on the server and found recently enabled resource governor. We disabled the resource governor and re-run query to see that our query ran amazingly fast as usual.

Query Specific Wait Statistics and SSMS

Now let us see how we can check Query Specific Wait Statistics with the help of SQL Server Management Studio (SSMS).

First, enable an actual execution plan for the query. Here is how you can enable the actual execution plan in SQL Server Management Studio (SSMS).

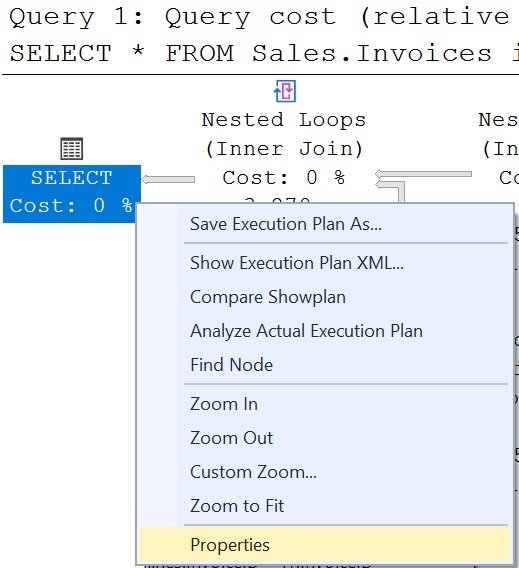
Next, run the query and right-click on the leftmost operator. In our case, we had the leftmost operator was a SELECT statement. On the right-click menu, there is an option to see the properties of the query.

SQL SERVER - Query Specific Wait Statistics and Performance Tuning queryspecific1

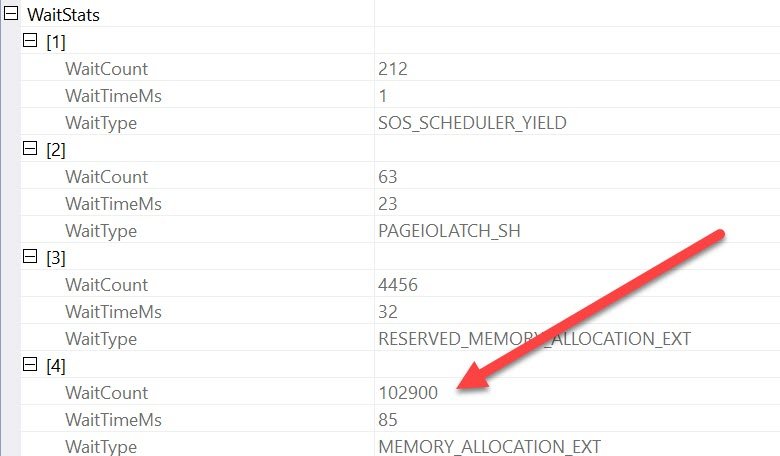
Once you open the properties bar in the SSMS, find the property WaitStats and expand in further. Over here you will see all the wait statistics related to the query.

SQL SERVER - Query Specific Wait Statistics and Performance Tuning queryspecific2

In our case, we found that there was a very high amount of wait on Memory Allocation and that lead me to find the root cause of memory pressure.

Please note that in our case, it was due to Resource Governor as it was incorrectly configured. Once the performance was restored for the query and server was running at optimal speed. We once again enabled Resource Governor with optimal settings.

Comprehensive Database Performance Health Check

There are many such stories I often encounter while I work with various clients during Comprehensive Database Performance Health Check engagement. In the last 10 years, I think I have pretty much seen most of the problems which one can encounter. Let me know if you are facing SQL Server Performance problem, I would love to help you tune your server.

I went Reference: Pinal Dave (https://blog.sqlauthority.com)

First appeared on SQL SERVER – Query Specific Wait Statistics and Performance Tuning

SQL SERVER – Enable Lock Pages in Memory LPIM

$
0
0

One of my recent clients had a very interesting situation of memory pressure, which we detected during the Comprehensive Database Performance Health Check. In most of the cases, my clients have either CPU pressure issue or the disk/IO issue. However, in this particular case, we had memory issue and after careful investigation, we found the troublemaker as a Lock Pages in Memory settings.

SQL SERVER - Enable Lock Pages in Memory LPIM lpim0-800x420

Resource Troubles

While the investigation of the system, I realized that the plan cache duration of various queries was often removed from the system. This was not good as it increased the work for the CPU where it has to constant recompile new plans. Eventually, this also leads to disk IO issue as data was not staying longer in the cache and it had to be pulled from the disk.

The typical question which I asked my client was – what changed since last time when everything was fine and their answer was Windows OS. This was a very strange issue for my client as they had no past history of the trouble and everything just started suddenly once they migrated from the older Windows OS to the newer Windows OS.

Well their answer to changing the OS made thing simple for me. Most of the people often forget to Enable Lock Pages in Memory or LPIM when they change the windows OS.

Lock Pages in Memory

When OS is running low on the memory, it starts clearing the cache of various application which is installed on the server. During the process, Windows also clears the plan cache for SQL Server and releases the memory back to the OS. However, there are some cases, the memory is released back to OS even though there is no memory pressure. In such a scenario we should Enable Lock Pages in Memory (LPIM).

Let us learn how we can enable the lock pages in memory.

To enable the lock pages in memory option

  1. First, find out which user account is running SQL Server. In my case, it was a Local System. You can do that from the services.
    SQL SERVER - Enable Lock Pages in Memory LPIM lpim1
  2. Next, go to the Start menu, click Run. In the Open box, type gpedit.msc.
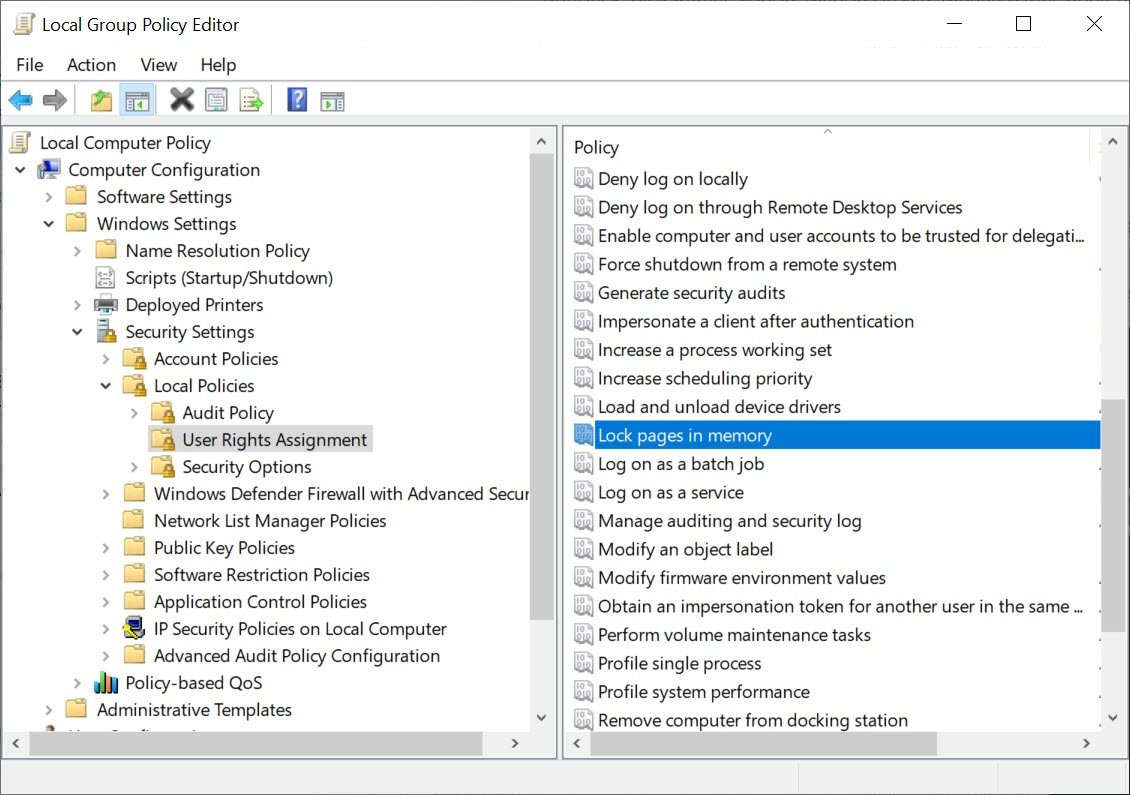
  3. On the Local Group Policy Editor console, expand Computer Configuration, expand Windows Settings, Expand Security Settings, and then expand Local Policies and select the User Rights Assignment folder.
  4. Double-click Lock pages in memory or right-click and go to properties
    SQL SERVER - Enable Lock Pages in Memory LPIM lpim2
  5. In the Local Security Setting – Lock pages in the memory dialog box, click Add User or Group and here add your user account which is running SQL Server.
    SQL SERVER - Enable Lock Pages in Memory LPIM lpim3
  6. Restart the SQL Server Services (It is mandatory)

After restarting the SQL Server services, we were able to move forward with normal performance for my clients.

Reference: Pinal Dave (https://blog.sqlauthority.com)

First appeared on SQL SERVER – Enable Lock Pages in Memory LPIM


SQL SERVER – Brief Note About RESOURCE_SEMAPHORE_QUERY_COMPILE Wait Type Resource

$
0
0

dmvust the other day, I wrote a blog post about SQL SERVER – Enable Lock Pages in Memory LPIM. I have received some amazing feedback about it and also lots of question. Though, I never expected I signed up four new clients for Comprehensive Database Performance Health Check after reading the blog post as well. I personally, I have can only accept new projects in late October as my calendar is 100% full. Today we will see Brief Note About RESOURCE_SEMAPHORE_QUERY_COMPILE resource Wait Type.

SQL SERVER - Brief Note About RESOURCE_SEMAPHORE_QUERY_COMPILE Wait Type Resource resource-800x527

RESOURCE_SEMAPHORE_QUERY_COMPILE Wait Type

I received lots of question on LinkedIn, Twitter that how did I determine that my client needed Lock Pages in Memory. The answer is very simple, I ran the SQL Wait Statistics Query and looked at various top wait types. When I ran the wait types script the very first wait type was RESOURCE_SEMAPHORE_QUERY_COMPILE, which told me that there is absolutely problem with query compiling. Lots of queries are continuously compiling again and again and that means the queries need more memory or the query compilation plan is not staying in the memory.

Here is the script which you can run and identify all the queries which are waiting for the resource semaphore query compilation.

SELECT sp.*, st.text
FROM sys.sysprocesses sp
CROSS APPLY sys.dm_exec_sql_text(sp.sql_handle) AS st
WHERE sp.lastwaittype LIKE 'RESOURCE_SEMAPHORE_QUERY_COMPILE%'
ORDER BY sp.waittime DESC;

The above query will not return any results if you have no memory issue with the query compilation.

When I checked on my client’s system, it was very clear that we needed either more memory to the system or more memory to the instance. As there was way more memory available on the system, it was easy for me to assume that there is some server-level configuration issue.

As mentioned in the previous blog post here, when I asked the DBA suggested that they had just changed the OS and I assumed the issue may be with the Lock Pages in Memory (LPIM).

Before I add more memory, I tried to Enable LPIM and I was able to resolve the issue of resources for my client.

If your server is running slow and wants me to help you speed up, you can avail my Comprehensive Database Performance Health Check at 33% discount. You can book it this month and can avail the service anytime before Dec 31st.

Reference: Pinal Dave (https://blog.sqlauthority.com)

First appeared on SQL SERVER – Brief Note About RESOURCE_SEMAPHORE_QUERY_COMPILE Wait Type Resource

SQL SERVER – Unable to Start SQL Server Service or Connect After Incorrectly Setting Max Server Memory to a Low Value

$
0
0

One of my clients contacted me for whom I assisted incomplete installation of SQL Server along with health check and backup automation. Here is the email which came across about max server memory.

Hi Pinal,

Please help! This is urgent as SQL Server is down. This is the one which you set up for us.

I was in SQL Server Management studio and I was going to put the memory allotted to 145000 MB and instead, I clicked OK when it was 14 MB. After that, I was unable to connect. I thought restart would help but now SQL Service is unable to start.

Quick help would be appreciated.

Thanks.
<Name Hidden>

Within 5 minutes I was online with them. Here is the error if you simulate the same scenario by setting SQL memory to the lowest value.

Max Server Memory

SQL SERVER - Unable to Start SQL Server Service or Connect After Incorrectly Setting Max Server Memory to a Low Value mem-too-low-01

Cannot connect to localhost.
——————————
ADDITIONAL INFORMATION:
The client was unable to establish a connection because of an error during connection initialization process before login. Possible causes include the following:  the client tried to connect to an unsupported version of SQL Server; the server was too busy to accept new connections; or there was a resource limitation (insufficient memory or maximum allowed connections) on the server. (provider: Shared Memory Provider, error: 0 – No process is on the other end of the pipe.) (Microsoft SQL Server, Error: 233)
——————————
No process is on the other end of the pipe
——————————

When I looked at ERRORLOG, here were the few lines about Max Server Memory.

  • Error: 701, Severity: 17, State: 65.
  • There is insufficient system memory in resource pool ‘internal’ to run this query.
  • Error: 17300, Severity: 16, State: 1. (Params:). The error is printed in terse mode because there was error during formatting. Tracing, ETW, notifications etc are skipped.
  • Error: 17300, Severity: 16, State: 1.
  • SQL Server was unable to run a new system task, either because there is insufficient memory or the number of configured sessions exceeds the maximum allowed in the server. Verify that the server has adequate memory. Use sp_configure with option ‘user connections’ to check the maximum number of user connections allowed. Use sys.dm_exec_sessions to check the current number of sessions, including user processes.
  • SQL Trace was stopped due to server shutdown. Trace ID = ‘1’. This is an informational message only; no user action is required.

The out of memory error (701: There is insufficient system memory in resource pool ‘internal’ to run this query.) is clearly side effect of what they have done by mistake. At this point, we need to start SQL and reconfigure memory to the value which they wanted to set.

WORKAROUND/SOLUTION

In this situation where SQL is not starting due to incorrect memory setting, we have a way to start SQL Service in minimal configuration using a parameter called as f. Here are the steps.

If SQL is running and you are not able to connect then first stop SQL Service. You can do it via command prompt, services applet or SQL Server Configuration Manager. There are chances that SQL Service might not stop then you may want to kill respective sqlservr.exe from task manager.

  1. Once SQL is stopped, we need to start with f parameter which stands for minimal configuration. There are multiple ways to do it and I would explain the easiest way.
    1. Open command prompt (Run as Administrator).
    2. For default instance run below:

NET START MSSQLSERVER /f /mSQLCMD

For named instance run below:

NET START MSSQL$INSTANCENAME /f /mSQLCMD

Make sure SQLCMD is in upper case.

SQL Service should start.

  1. Connect to SQL using SQLCMD. Note that SSMS and other tool won’t work as we have allowed connection via only SQLCMD using /m parameter. This is to ensure that the application is not taking connection before us.
  2. Check max server memory using below command.
sp_configure 'max server memory'

you should notice a low value in config_value column.

  1. To reset the value to your desired value (in MB), run below command. I have put value like 12000 which is equal to 12 GB.
sp_configure 'max server memory', 12000
  1. Run reconfigure command.
reconfigure with override
  1. Verify that value set in step 4 is visible in the output. Same command as step 3.
sp_configure 'max server memory'
  1. Once you are satisfied “exit” from the SQLCMD. Now stop SQL Service as its running with special parameters.
  1. For default instance run below:
    NET STOP MSSQLSERVER
  2. For named instance run below:
    NET STOP MSSQL$INSTANCENAME

SQL Service should stop.

  1. Now you are free to start SQL using any method which is easier for you. If its cluster then you need to bring SQL resource online via Failover Cluster Manager. Here is the command to start SQL from the command prompt. This is same as Step 1 but without any extra parameter.
  1. For default instance run below:
    NET START MSSQLSERVER
  2. For named instance run below:
    NET START MSSQL$INSTANCENAME

SQL Service should start.

Here is the pictorial representation of steps.

SQL SERVER - Unable to Start SQL Server Service or Connect After Incorrectly Setting Max Server Memory to a Low Value mem-too-low-02

Hope this article would help someone who is in trouble and wants to fix the issue ASAP. Please provide feedback via the comments section. SQL SERVER –Start Stop Restart SQL Server From Command Prompt

Reference: Pinal Dave (https://blog.sqlauthority.com)

First appeared on SQL SERVER – Unable to Start SQL Server Service or Connect After Incorrectly Setting Max Server Memory to a Low Value

SQL SERVER – Listing All Memory Optimized Files with Logical Name and Physical Name

$
0
0

I love my job as SQL Server Performance Tuning Expert and I also appreciate how I am able to help many different organizations with Comprehensive Database Performance Health Check. However, once in a while I end up working with clients who have a very bureaucratic system in the place where everything and every step one has to document. Recently I had to work with a client for whom I have to build a script for Listing All Memory Optimized Files with Logical Name and Physical Name.

SQL SERVER - Listing All Memory Optimized Files with Logical Name and Physical Name Physical-Name-800x192

Here is the script which discusses How to List All Memory Optimized Tables in SQL Server? In this blog post, we will look at how to list All Memory Optimized Files with Logical Name and Physical Name.

SELECT 
       df.[name] As [LogicalName],
       df.[physical_name] As [PhysicalName],
	   CAST(SUM(xcf.file_size_in_bytes)/1024/1024*1.0 
				AS DECIMAL(9,3)) As [SizeGB]
FROM sys.dm_db_xtp_checkpoint_files As xcf
INNER JOIN sys.database_files As df On DF.file_id = xcf.container_id
GROUP BY df.[file_id], df.[name], df.[physical_name]

When I ran the above script for my database I got the following results.

SQL SERVER - Listing All Memory Optimized Files with Logical Name and Physical Name resultofin-memoryquery

Here are a few additional blog posts related to this topic:

Looking at the market trends of the tumbling cost of RAM (USD/MB) and performance implication of reading data from memory vs disk, it’s evident that people would love to keep the data in memory. With this evolution in the hardware industry, the software has to be evolved and modified so that they can take advantage and scale as much as possible. On the other hand, businesses also don’t want to compromise the durability of data – restart would clear RAM, but data should be back in the same state as it was before the failure.

Reference: Pinal Dave (https://blog.sqlauthority.com)

First appeared on SQL SERVER – Listing All Memory Optimized Files with Logical Name and Physical Name

SQL SERVER – Memory Grant Feedback – No Feedback Disabled

$
0
0

From the last few days, I am sharing my experience with the Memory Grant Feedback feature of SQL Server 2019. I love my job as I get to learn various new technology while working on Comprehensive Database Performance Health Check. Today we will discuss a very interesting topic of MemoryGrantInfo when the value of the IsMemoryGrantFeedbackAdjusted property displays No Feedback Disabled.

SQL SERVER - Memory Grant Feedback - No Feedback Disabled Feedback-Disabled-800x202

To understand the basics of the Memory Grant Feedback, I suggest you read this blog post: Introduction to Memory Grant Feedback.  To understand various values of the property IsMemoryGrantFeedbackAdjusted you can read the blog post Memory Grant Feedback – MemoryGrantInfo and IsMemoryGrantFeedbackAdjusted.  We will be using the same query which we had used in the earlier blog post.

Demonstration – No Feedback Disabled

First, create the following stored procedure in the WideWorldImporters sample database.

USE WideWorldImporters
GO
CREATE OR ALTER PROCEDURE GetStockDetails (@StockItemID INT)
AS
SELECT ol.OrderID,ol.StockItemID,ol.Description,
ol.OrderLineID,
o.Comments, o.CustomerID
FROM Sales.OrderLines ol
INNER JOIN Sales.Orders o ON ol.OrderID = o.OrderID
WHERE ol.StockItemID > @StockItemID
ORDER BY ol.Description, o.Comments
GO

Now we will be running the above-stored procedure multiple times with different values. However, before you run the stored procedure, enable the actual execution plan by typing CTRL +M or following this blog post.

Now run the following stored procedures 20 times. If you notice there are two different values for a stored procedure.

EXEC GetStockDetails 120
EXEC GetStockDetails 223
GO 20

Please note that I am running the stored procedures 20 times so there will be a total of 40 executions. Now check the execution plan of 31, 32 and 33rd execution plan. You will notice that on the 33rd execution plan there is a different value in the Memory Grant Feedback. You will see as we run the above-stored procedure the memory requirements keep on changing and at one point SQL Server Engine gives up and says it is going to use one of the initial memory grants and uses the memory grant of the very first execution. As you will notice in our case that would be very horrible.

SQL SERVER - Memory Grant Feedback - No Feedback Disabled nofeedback

Feedback Disabled

Well, the learning from this exercise is that while the feature of Memory Grant Feedback is awesome, it is can backfire as well and give you poor performance. We will see how to identify the queries which have this feature disable and also how to disable the feature entirely in future blog posts.

Reference: Pinal Dave (https://blog.sqlauthority.com)

First appeared on SQL SERVER – Memory Grant Feedback – No Feedback Disabled

SQL SERVER – Disable Memory Grant Feedback at Database Level and Query Level

$
0
0

If you are a regular reader of this blog post, you probably know that I have been recently writing a small series on my experience with the Memory Grant Feedback feature of SQL Server 2019. I feel so lucky that in the release of just 3 weeks, I got the opportunity to tune the latest version of SQL Server while working on a Comprehensive Database Performance Health Check. Today we will see how to disable memory grant feedback at Database Level and Query Level.

SQL SERVER - Disable Memory Grant Feedback at Database Level and Query Level disable-query-feedback-800x648

Brief History

Three weeks ago, SQL Server 2019 released and one of my clients upgraded to SQL Server 2019. As soon as they upgraded to the latest version of SQL Server, they had performance regression. They immediately hired me and we worked together Comprehensive Database Performance Health Check and improved the performance of the server. While working together we noticed a very interesting pattern for one particular query which kept on giving us unexpected performance problems.

Here are a few blog posts which you may find interesting about Memory Grant Feedback:

Senior DBA of the organization where I was consulting and I had spent some really good time understanding the query pattern and heuristics. After a while, we figured out the problem and it was related to brand new feature Memory Grant Feedback.

Now don’t get me wrong this feature is a great feature that worked very well for 99% of the queries in our system. Just one stored procedure was acting weird with this query. As this was a brand new feature it took us a while to figure out what to do with this feature. Eventually, we decided to disable it.

There are two different ways to disable memory grant feedback, we will see the syntax of both the methods here.

Disable Memory Grant Feedback at Database Level

You can easily disable this feature at the database level by running the following command.

ALTER DATABASE SCOPED CONFIGURATION 
SET DISABLE_BATCH_MODE_MEMORY_GRANT_FEEDBACK = OFF;

We did this first on our client and realized that it has negatively impacted our server so we immediately turned this one back on.

ALTER DATABASE SCOPED CONFIGURATION 
SET DISABLE_BATCH_MODE_MEMORY_GRANT_FEEDBACK = ON;

The next task was to disable this feature at the query level.

Disable Memory Grant Feedback at Query Level

As disabling memory grant at the server level was not a great idea, Sr DBA and I decided to disable it at the query level.

For example, if the following is my query, I would disable the memory grant feedback by adding the option hint at the end of the query.

SELECT ol.OrderID,ol.StockItemID,ol.Description,
ol.OrderLineID,
o.Comments, o.CustomerID
FROM Sales.OrderLines ol
INNER JOIN Sales.Orders o ON ol.OrderID = o.OrderID
WHERE ol.StockItemID > @StockItemID
ORDER BY ol.Description, o.Comments
OPTION (USE HINT ('DISABLE_BATCH_MODE_MEMORY_GRANT_FEEDBACK'))

When you run the above query, it had disabled the memory grant feedback and used one static memory for the query. Once we use this option for a specific query, our performance for that one query was restored.

Please note that do not use either of this option without proper consultation of a SQL Server Performance Tuning Expert in your organizations. It is quite possible without proper diagnosis and investigation, this option may reduce your SQL Server performance rather than increasing it.

Reference: Pinal Dave (https://blog.sqlauthority.com)

First appeared on SQL SERVER – Disable Memory Grant Feedback at Database Level and Query Level

MemoryGrantInfo – What are Different Status of IsMemoryGrantFeedbackAdjusted? – Interview Question of the Week #253

$
0
0

Question: What are Different Status of IsMemoryGrantFeedbackAdjusted (MemoryGrantInfo Property)?

Answer: This question is actually made up by me and was never asked in an interview. The source of the question is all the blog posts that I have been writing this week on the topic of Memory Grant Feedback. Today we will see a consolidated answer to this question which I have discussed across multiple of the blog posts.

MemoryGrantInfo - What are Different Status of IsMemoryGrantFeedbackAdjusted? - Interview Question of the Week #253 MemoryGrantInfo-800x172

Here are the five states of the IsMemoryGrantFeedbackAdjusted property which is the sub-property of the MemoryGrantInfo. First, go to any execution plan and click on the left-most SELECT operator. Right Click over it and go to the property. Now this will open the separate property window on the right slide. In this window further example the property MemoryGrantInfo. Right under this property, there will be many different properties. Now pay attention to the property – IsMemoryGrantFeedbackAdjusted.

MemoryGrantInfo - What are Different Status of IsMemoryGrantFeedbackAdjusted? - Interview Question of the Week #253 memorygrant

MemoryGrantInfo - What are Different Status of IsMemoryGrantFeedbackAdjusted? - Interview Question of the Week #253 memorygrants1

Now let us discuss various states of IsMemoryGrantFeedbackAdjusted.

NoFirstExecution: When you execute the stored procedure first time you will find the following details in the column IsMemoryGrantFeedbackAdjusted – NoFirstExecution. That means, the query has run the first time and there is no history available for adjusting the memory.

YesAdjusting: This means the memory grant feedback is now taking feedback from the earlier execution and adjusting it for the next execution.

YesStable: This means the memory grant has found the most optimal value and has applied to the query.

NoAccurateGrant: This means there was no need for an additional memory grant and there was no spill on the disk.

NoFeedbackDisabled: This happens when SQL Server Engine is not able to figure out what is the best possible memory grant for the query and stop adjusting the memory grant after a few attempts (32 to be precise).

If you want to learn more about Memory Grant Feedback, here are a few additional blog posts where you can learn more about this topic.

Reference: Pinal Dave (https://blog.sqlauthority.com)

First appeared on MemoryGrantInfo – What are Different Status of IsMemoryGrantFeedbackAdjusted? – Interview Question of the Week #253

SQL SERVER – MemoryGrantInfo Property Explanation

$
0
0

I have been writing about the Memory Grant Feedback feature for a while on this blog and I am extremely delighted to see lots of questions and interactions on this topic. Today we will discuss various properties of MemoryGrantInfo in this blog post. If you want to learn more about Memory Grant Feedback, I suggest you read the following blog posts before you continue reading this blog.

Today we will discuss the various elements of the MemoryGrantInfo Property.

First, go to any execution plan and click on the left-most SELECT operator. Right Click over it and go to the property. Now this will open the separate property window on the right slide. In this window further example the property MemoryGrantInfo. Right under this property, there will be many different properties.

SQL SERVER - MemoryGrantInfo Property Explanation memorygrantsall-800x617

Let us understand what each element means.

Desired Memory: This is the total desired memory for the query to execute. If the plan is a parallel plan, this value will have an added value that is needed on the top of the Required Memory. In our case, the example the plan is serial, so the value of this property will be the same as Required Memory.

Granted Memory: This is the amount of memory that was finally granted to the query by the SQL Server Engine from all the available memory.

Grant Wait Time: This time indicates how much the query had to wait before it was granted the memory to execute. This is the amount of time in milliseconds. You can read more about this topic by searching on the internet about the DMV sys.dm_exec_query_memory_grants.

Is Memory Grant Feedback Adjusted:  This indicates the current state of the memory grant feedback for the query. There are five different states for this configuration. Here are the five different values: NoFirstExecution, YesAdjusting, YesStable, NoAccurateGrant, NoFeedbackDisabled. Each of the values has different meaning and I have previously blogged about this in detail over here: Different Status of Is Memory Grant Feedback Adjusted.

Last Requested Memory: This indicates the granted memory in Kilobytes (KB) from the previous execution of the same query or statement. If you see the status of the is memory grant feedback adjusted property to YesAdjusting, it is quite possible that Last Requested Memory may be different from the currently Granted Memory.

Max Query Memory: This indicates the maximum amount of memory available for individual query grants. This value depends on the overall memory consumptions of the various SQL Server components and keeps on changing for every query. I have never seen SQL Server granting more memory to query which is greater than Max Query Memory.

Max Used Memory: This value represents how much memory the query actually used during the execution irrespective of what was granted to the query and how long it actually had to wait to execute the query.

Requested Memory: This value represents the amount of memory asked from the resource semaphore. When any query is executed SQL Server Engine checks if the desired memory exceeds the Max Query Memory or not, if it exceeds, then it reduces the requested memory till it fits the limit of Max Query Memory.

Required Memory: This indicates the total required memory for the query to start executing. If the query is running on a single degree of parallelism, the value of this will be the same as the serial required memory. If the query is running on multiple degrees of parallelism the value of this will be equal to (Serial Required Memory) * (Degree of Parallelism) + Parallelism Exchange Operators.

Serial Desired Memory: This indicates the sum of all the memory desired to execute the query based on the cardinality and data size estimation while it is running on a single degree of parallelism. This value calculated the query compiled time and usually the same or more than the Serial Required Memory.

Serial Required Memory: This is the minimum amount of memory required for the query to start execution while it is running on a single degree of parallelism. This memory is absolutely needed to create the internal data structure for the memory consuming operators.

Well, that’s it. I think we have discussed about this subject in detail. Let me know if you have any questions about this topic. There are many such topics, we discuss while working together on Comprehensive Database Performance Health Check.

Reference: Pinal Dave (https://blog.sqlauthority.com)

First appeared on SQL SERVER – MemoryGrantInfo Property Explanation


SQL SERVER – Extended Event to Capture Memory Grant Feedback

$
0
0

It has been over 3 weeks since SQL Server 2019 launched and after reading my recent blog posts about the Memory Grant Feedback, I was approached by one of the leading banks in Europe to help them build an efficient architecture and performance-optimized system Comprehensive Database Performance Health Check. In this blog post, we will learn about the extended event to capture memory grant feedback. You can read more about Memory Grant Feedback over here, here, here, here, here and here.

SQL SERVER - Extended Event to Capture Memory Grant Feedback capturememory0-800x237

Brief History

While I worked with the client to get ready for their migration of SQL Server 2019, we realized that there are few queries giving us trouble with regards to performance. As I have done a similar task, just a week before for another client, I exactly knew the problem for my client. I have previously blogged about it why I have disabled the Memory Grant Feedback at the Query Level.

However, as this time we realized that there are many queries which were facing the same issue, we decided to identify those queries with the help of the Extended Event. Once we identified the queries with the extended events, we were able to tune the queries together.

Capture Memory Grant Feedback

Let us see how we can create an extended event to Capture Memory Grant Feedback.

You can create an extended event by running the following script:

CREATE EVENT SESSION [MemoryGrantFeedback] ON SERVER
ADD EVENT sqlserver.memory_grant_feedback_loop_disabled(
ACTION(sqlserver.database_name,sqlserver.plan_handle,sqlserver.sql_text)),
ADD EVENT sqlserver.memory_grant_updated_by_feedback(
ACTION(sqlserver.database_name,sqlserver.plan_handle,sqlserver.sql_text))
WITH (MAX_MEMORY=4096 KB,EVENT_RETENTION_MODE=ALLOW_SINGLE_EVENT_LOSS,MAX_DISPATCH_LATENCY=30
 SECONDS,MAX_EVENT_SIZE=0 KB,MEMORY_PARTITION_MODE=NONE,TRACK_CAUSALITY=OFF,STARTUP_STATE=OFF)
GO

However, if you want to use the wizard, you can follow the steps displaced here in the images.

SQL SERVER - Extended Event to Capture Memory Grant Feedback capturememory1

SQL SERVER - Extended Event to Capture Memory Grant Feedback capturememory2

SQL SERVER - Extended Event to Capture Memory Grant Feedback capturememory3

SQL SERVER - Extended Event to Capture Memory Grant Feedback capturememory4

SQL SERVER - Extended Event to Capture Memory Grant Feedback capturememory5

SQL SERVER - Extended Event to Capture Memory Grant Feedback capturememory6

SQL SERVER - Extended Event to Capture Memory Grant Feedback capturememory7

SQL SERVER - Extended Event to Capture Memory Grant Feedback capturememory8

SQL SERVER - Extended Event to Capture Memory Grant Feedback capturememory9

SQL SERVER - Extended Event to Capture Memory Grant Feedback capturememory10

SQL SERVER - Extended Event to Capture Memory Grant Feedback capturememory11

Now once the extended event is created and enabled. Right-click on it and select “Watch Live Data“. Initial it will be empty. Now go to the blog post mentioned here and create the stored procedure displayed in the blog post. Next, run the following stored procedure 20 times by executing the following code. As we are running two stored procedure the total execution will be of 40 times.

EXEC GetStockDetails 120
EXEC GetStockDetails 223
GO 20

Continue to watch the live data while the stored procedure is executing and you will see various events being recorded in the live stream. Even though the stored procedure is executed a total of 40 times, it will record lesser events in the extended events as it will stop the feedback loop.

SQL SERVER - Extended Event to Capture Memory Grant Feedback capturememory12

You will notice that after 32nd execution, the memory grant update by feedback is disabled.

SQL SERVER - Extended Event to Capture Memory Grant Feedback capturememory13

If you look carefully in the details area, you can also find the stored procedure which is creating this behavior.

At my client’s place, we identified all such stored procedures and tuned them one at a time. Currently, their system is running extremely smooth and very efficient.

Reference: Pinal Dave (https://blog.sqlauthority.com)

First appeared on SQL SERVER – Extended Event to Capture Memory Grant Feedback

SQL SERVER – Row Mode and Memory Grant Feedback

$
0
0

Earlier this year, I had a great time writing on the Memory Grant Feedback. I have received a lot of questions about this feature and I have tried my best to answer each of them. One of the questions, which really caught my attention did this feature work with Row Mode like it does with Batch Mode. This question indeed threw me off because nowhere I had mentioned earlier that this is Batch Mode only feature. You can read more about Memory Grant Feedback over hereherehereherehere, here and here.

SQL SERVER - Row Mode and Memory Grant Feedback RowMode-800x424

However, I can clearly see where actually the confusion started with the blog readers that Memory Grant Feedback may be the Batch Mode feature and not Row Mode feature. This is because, in all the above blog posts, I used the example which was the table that contained the ColumnStore Index, which eventually displayed Batch Mode execution on the operator.

Honestly, the Memory Grant Feedback feature works equally well on the RowMode as well as on the BatchMode. Click here to see the example of the Batch Mode and Memory Grant Feedback.

Row Mode

Here is a very simple example where I have not used stored procedure or anything. Just a simple select query and I will execute it two times. There is no column store index or anything on it.

USE WideWorldImporters
GO
SELECT *
FROM Sales.Orders
WHERE PickedByPersonID = 10
ORDER BY SalespersonPersonID
GO

SQL SERVER - Row Mode and Memory Grant Feedback memorygrantrow1

It is a Row Mode query and when you run it the first time there is a memory grant issue and when we run it the second time the memory grant issue disappears.

SQL SERVER - Row Mode and Memory Grant Feedback memorygrantrow2

This simple example proves that the Memory Grant Feedback feature is equally helpful in the Row Mode and Batch Mode process.

If you want to disable Batch Mode Memory Grant Feedback, you can follow this blog post and disable it: Disable Memory Grant Feedback at Database Level and Query Level. However, if you want to disable row Mode Memory Grant feedback, here is the example for the same.

Disable Memory Grant Feedback at Database Level

You can easily disable this feature at the database level by running the following command.

ALTER DATABASE SCOPED CONFIGURATION
SET DISABLE_ROW_MODE_MEMORY_GRANT_FEEDBACK = OFF;

We did this first on our client and realized that it has negatively impacted our server so we immediately turned this one back on.

ALTER DATABASE SCOPED CONFIGURATION
SET DISABLE_ROW_MODE_MEMORY_GRANT_FEEDBACK = ON;

The next task was to disable this feature at the query level.

Disable Memory Grant Feedback at Query Level

As disabling memory grant at the server level was not a great idea, Sr DBA and I decided to disable it at the query level.

For example, if the following is my query, I would disable the memory grant feedback by adding the option hint at the end of the query.

SELECT *
FROM Sales.Orders
WHERE PickedByPersonID = 10
ORDER BY SalespersonPersonID
OPTION (USE HINT ('DISABLE_ROW_MODE_MEMORY_GRANT_FEEDBACK'))

Please note that do not use either of this option without proper consultation of a SQL Server Performance Tuning Expert in your organizations. It is quite possible without proper diagnosis and investigation, this option may reduce your SQL Server performance rather than increasing it. I often help to check this process in my Comprehensive Database Performance Health Check.

Reference: Pinal Dave (https://blog.sqlauthority.com)

First appeared on SQL SERVER – Row Mode and Memory Grant Feedback

SQL SERVER – List Number Queries Waiting for Memory Grant Pending

$
0
0

I have been recently writing about Memory Grant Feedback a lot and I have received a lot of questions about it. I have been answering each of them personally but some questions are so good that I feel like answering them on the blog will help more people. Today, in this blog post let us see how we can List Number Queries Waiting for Memory Grant Pending. I had built this simple query for my Comprehensive Database Performance Health Check.

SQL SERVER - List Number Queries Waiting for Memory Grant Pending Memory-Grant-Pending-800x171

Memory Grant Pending

Here is the query which I run to know how many queries in my system are still waiting for the memory grant.

SELECT @@SERVERNAME AS [Server Name],
cntr_value AS [Memory Grants Pending]
FROM sys.dm_os_performance_counters WITH (NOLOCK)
WHERE [object_name] LIKE N'%Memory Manager%'
AND counter_name = N'Memory Grants Pending'

If I see the counter value to zero, that is a good thing as there are not queries which are waiting on the memory grant and there is absolutely no issue with the performance of your query.

I usually run this query multiple times to make sure that indeed the value which I am getting via my query is consistent across an interval of time.

If I see very high value in my counter, I usually run the query which is listed on the blog How to List Queries With Memory Grant and Execution Plan? post which lists all the queries which need memory grant and their value. Please note that this query will not display all the running queries, it will only display the queries which need memory grant and display that. I am re-producing the query here for your easy reference.

SELECT mg.session_id
,mg.granted_memory_kb
,mg.requested_memory_kb
,mg.ideal_memory_kb
,mg.request_time
,mg.grant_time
,mg.query_cost
,mg.dop
,st.[TEXT]
,qp.query_plan
FROM sys.dm_exec_query_memory_grants AS mg
CROSS APPLY sys.dm_exec_sql_text(mg.plan_handle) AS st
CROSS APPLY sys.dm_exec_query_plan(mg.plan_handle) AS qp
ORDER BY mg.required_memory_kb DESC;

Please note that this query will not display all the running queries, it will only display the queries which need memory grant and display that. Pay special attention to the column grant_time, if the value of this column is NULL, that means the query is still waiting for the memory grant.

Well, that’s it, I hope this blog post helps you to identify if your system is struggling with the memory or not. If there is memory pressure, you can also look at the queries which need help by running the query listed in this blog post.

Here are additional blog posts, I suggest you read to learn more about the new feature of SQL Server, Memory Grant Feedback.

Run the query on your server and do let me know if you find the queries helpful to you or not. If you want me to add more columns to the query, do let me know and I will be happy to look at the request and modify the query to be meaningful to everyone.

Reference: Pinal Dave (https://blog.sqlauthority.com)

First appeared on SQL SERVER – List Number Queries Waiting for Memory Grant Pending

SQL SERVER 2019 – How to Enable Lock Paged in Memory LPIM?

$
0
0

With the release of SQL Server 2019, there were enhancements that are known and talked about. There are few minor changes in SQL Server Configuration Manager which were un-noticed. In this blog, I would talk about enhancement in SQL Server 2019 Configuration Manager. Let us learn how to enable lock paged in memory (LPIM).

SQL SERVER 2019 - How to Enable Lock Paged in Memory LPIM? lockedpagesinmemory-800x211

Earlier I wrote a blog about Instant file Initialization option in SQL Server 2019 Configuration Manager. SQL SERVER 2019 – How to Turn On or Enable Instant File Initialization?

In this blog, I would share another new setting visible, “Lock Pages In Memory”. Most of the DBAs know about this and know how to make changes. I have written the below blog which covers the same.

Enable Lock Pages in Memory

When OS is running low on the memory, it starts clearing the cache of various application which is installed on the server. During the process, Windows also clears the plan cache for SQL Server and releases the memory back to the OS. However, there are some cases, the memory is released back to OS even though there is no memory pressure. In such a scenario we should Enable Lock Pages in Memory (LPIM).

Let’s look at the SQL Server 2019 Configuration Manager. You need to go to the “Advanced” tab to view the setting.

SQL SERVER 2019 - How to Enable Lock Paged in Memory LPIM? sscm-lpim-01

This is the dropdown from where you can view or change the settings. As the description says “Grants Lock Pages In Memory privilege to SQL Server Database Engine Service Account”

Once I change the settings, I verified and it works as documented, the account got added automatically without all the hassle.

SQL SERVER 2019 - How to Enable Lock Paged in Memory LPIM? sscm-lpim-02

I hope you enjoyed reading as much as I enjoyed writing it. I will share more new things about SQL Server 2019 in upcoming blogs.

Reference: Pinal Dave (https://blog.sqlauthority.com)

First appeared on SQL SERVER 2019 – How to Enable Lock Paged in Memory LPIM?

What is TempDB Spill in SQL Server? – Interview Question of the Week #259

$
0
0

Question: What is TempDB Spill in SQL Server?

Answer: When SQL Server poorly (incorrectly) estimates the number of rows that will be returned from any operator, it requests an incorrect amount of memory grant from the SQL Server engine, which leads to an inefficient execution plan. If the inefficient plan has a relatively small memory grant, SQL Server will need additional space on the disk to do the necessary work (like join, order by). When SQL Server uses TempDB when any query does not have enough memory to do its operation, it is called TempDB Spill.

What is TempDB Spill in SQL Server? - Interview Question of the Week #259 TempDB-Spill-800x234

Whenever you see any execution plan with a TempDB Spill, trust me there are always chances that you can improve that queries performance. Here are a few generic suggestions:

  • Update statistics with full scan
  • Create covering indexes
  • Use temp tables instead of subqueries
  • Divide a huge query into multiple small queries
  • Re-write queries to avoid parameter sniffing
  • Many more…

There are many different ways you can improve the performance of the query, and not anyone solution works for every query.

Whenever I see the TempDB Spill my personal instinct is to look at the query and try to understand if there is anything we can do to avoid the spills without changing anything in the schema.

In recent times, I have seen parameter sniffing also big trouble during my Comprehensive Database Performance Health Check. Here is a set of articles that I have written that can be very helpful if you are facing any performance problem due to parameter sniffing issues.

Reference: Pinal Dave (https://blog.sqlauthority.com)

First appeared on What is TempDB Spill in SQL Server? – Interview Question of the Week #259

Viewing all 93 articles
Browse latest View live


Latest Images